
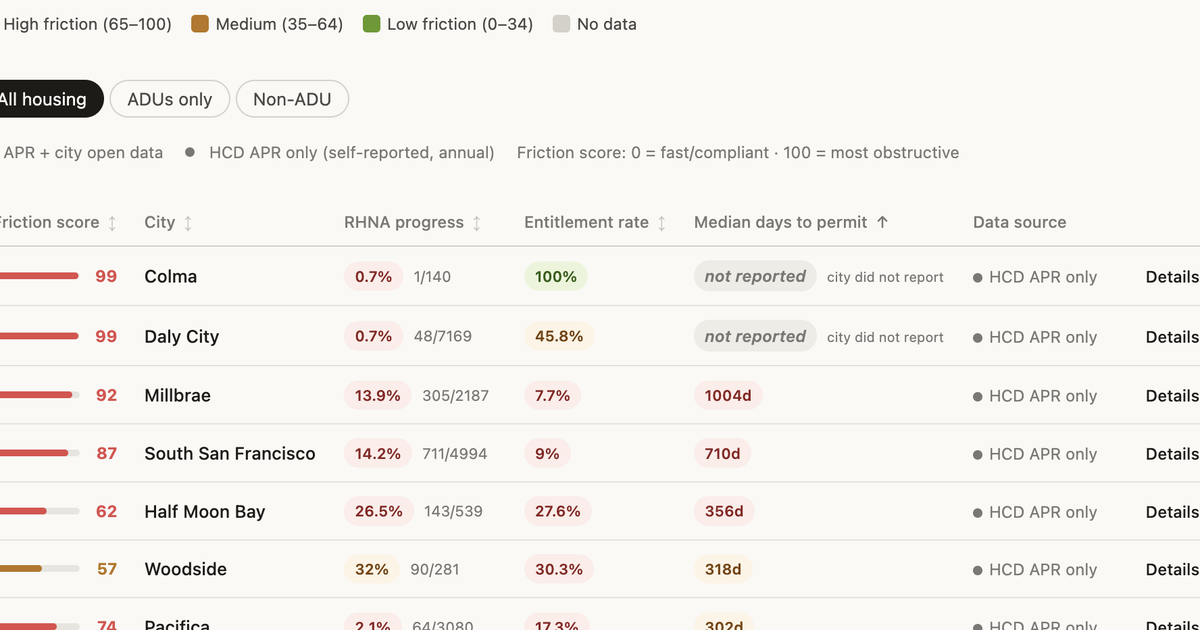

Every housing fight on the Peninsula eventually narrows to the same question: how long is this going to take? Until now, the answer has lived in scattered HCD filings, city annual reports, and the institutional memory of the developers and staff who navigate each jurisdiction separately. There was no single place to compare a project's odds in Burlingame against the same project in Redwood City, or to see whether your city's ADU rules are actually working.
So we built one.
→ peninsulaforeveryone.github.io/permit-timeline-tracker
For each of the Peninsula's 22 cities, the tracker surfaces:
- A friction score — how much delay and process a housing project faces between application and approval, comparable across jurisdictions.
- RHNA progress — where the city stands against its 6th-cycle housing obligations, by income band.
- ADU compliance — whether the city's accessory dwelling unit rules and timelines hold up against state law, and how its permit volume compares to its neighbors.
The data is not ours. Cities report it to California's HCD themselves. What the tracker does is make it comparable — pulling figures out of scattered annual progress reports and putting them side by side, on one page, in a form your neighbors can read.
Why does this matter now? The 6th RHNA cycle runs through 2031, and the cities most behind on their obligations are the same cities where projects face the longest review timelines and the highest per-unit friction. State law has consequences for non-compliance: the Builder's Remedy, HCD enforcement referrals, loss of local control over project review. None of that is hypothetical anymore. What was missing was a way for residents to see, in one place, where their city actually stands.
Find your city. Check the score. Share it.